Review Workload Events
The Reporting Dashboard shows the Workload Events that Agent Proxy generates as traffic flows between your Client Workloads and Server Workloads. For background on what these events contain, see Workload Events.
View workload events
Section titled “View workload events”To see detailed information about workload events, follow these steps:
-
Log into your Aembit Tenant.
-
Click Reporting.
-
Click the Workload Events tab at the top of the Reporting Dashboard.
-
Click the filter icon to apply any filters or the refresh icon to retrieve the latest events.
The following filters are available:
| Filter | Description |
|---|---|
| Timespan | The period of time you would like to have event data displayed. |
| Application Protocols | The application protocol type to filter by. |
| Severity | Filter by event severity: Error, Warning, or Info. |
| Server Workload Name | Filter by a specific Server Workload. |
| Client Workload Name | Filter by a specific Client Workload. |
| User (MCP App Protocol only) | Filter MCP Workload Events to a specific user. Available only when filtering by Application Protocol = MCP. Matches the application.mcp.userId field. |
Event details
Section titled “Event details”When you select a workload event from the dashboard, you can expand the view to display detailed data for that event.
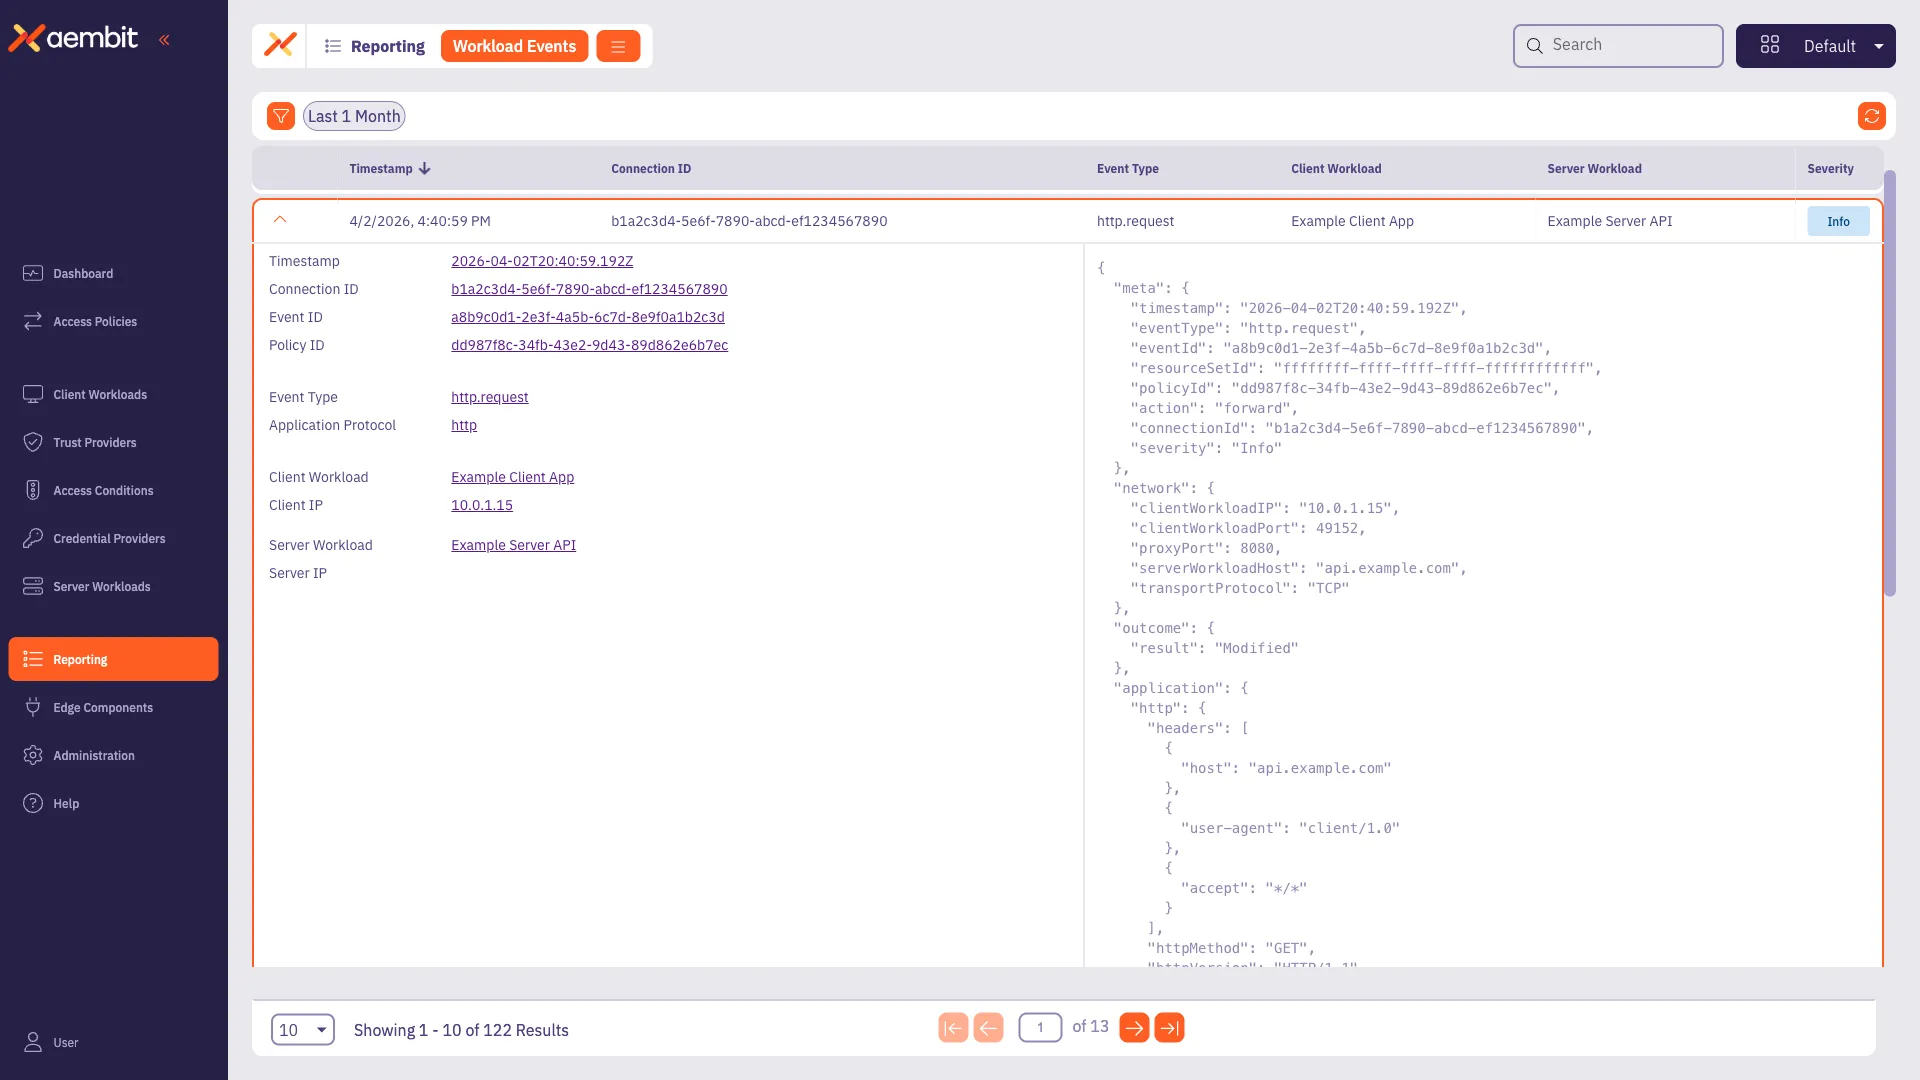
The expanded view displays the event metadata, workload identification, network details, outcome, and protocol-specific application data. For a description of each field, see the Workload Event reference.