How to stream Aembit events to Splunk SIEM
Aembit’s Log Stream to Splunk Security Information and Event Management (SIEM) feature enables rapid streaming of Aembit Edge event logs and audit logs directly to Splunk. This integration uses the HTTP Event Collector (HEC) protocol to deliver comprehensive security data, enhancing threat detection capabilities, improving incident management, and streamlining compliance monitoring for your organization.
Prerequisites
Section titled “Prerequisites”Before you can stream Aembit events to Splunk SIEM, you must have an HTTP Event Collector (HEC) set up in your Splunk environment with the following attributes:
- Source Type - Miscellaneous ->
generic_single_line. - Default Index -
Default.
Use your HEC’s Source Name and Token Value in your Splunk SIEM Log Stream configuration.
To configure an HEC in Splunk, see Set up and use HTTP Event Collector in Splunk Web in Splunk’s official docs.
Create a Splunk SIEM Log Stream
Section titled “Create a Splunk SIEM Log Stream”-
Log into your Aembit Tenant.
-
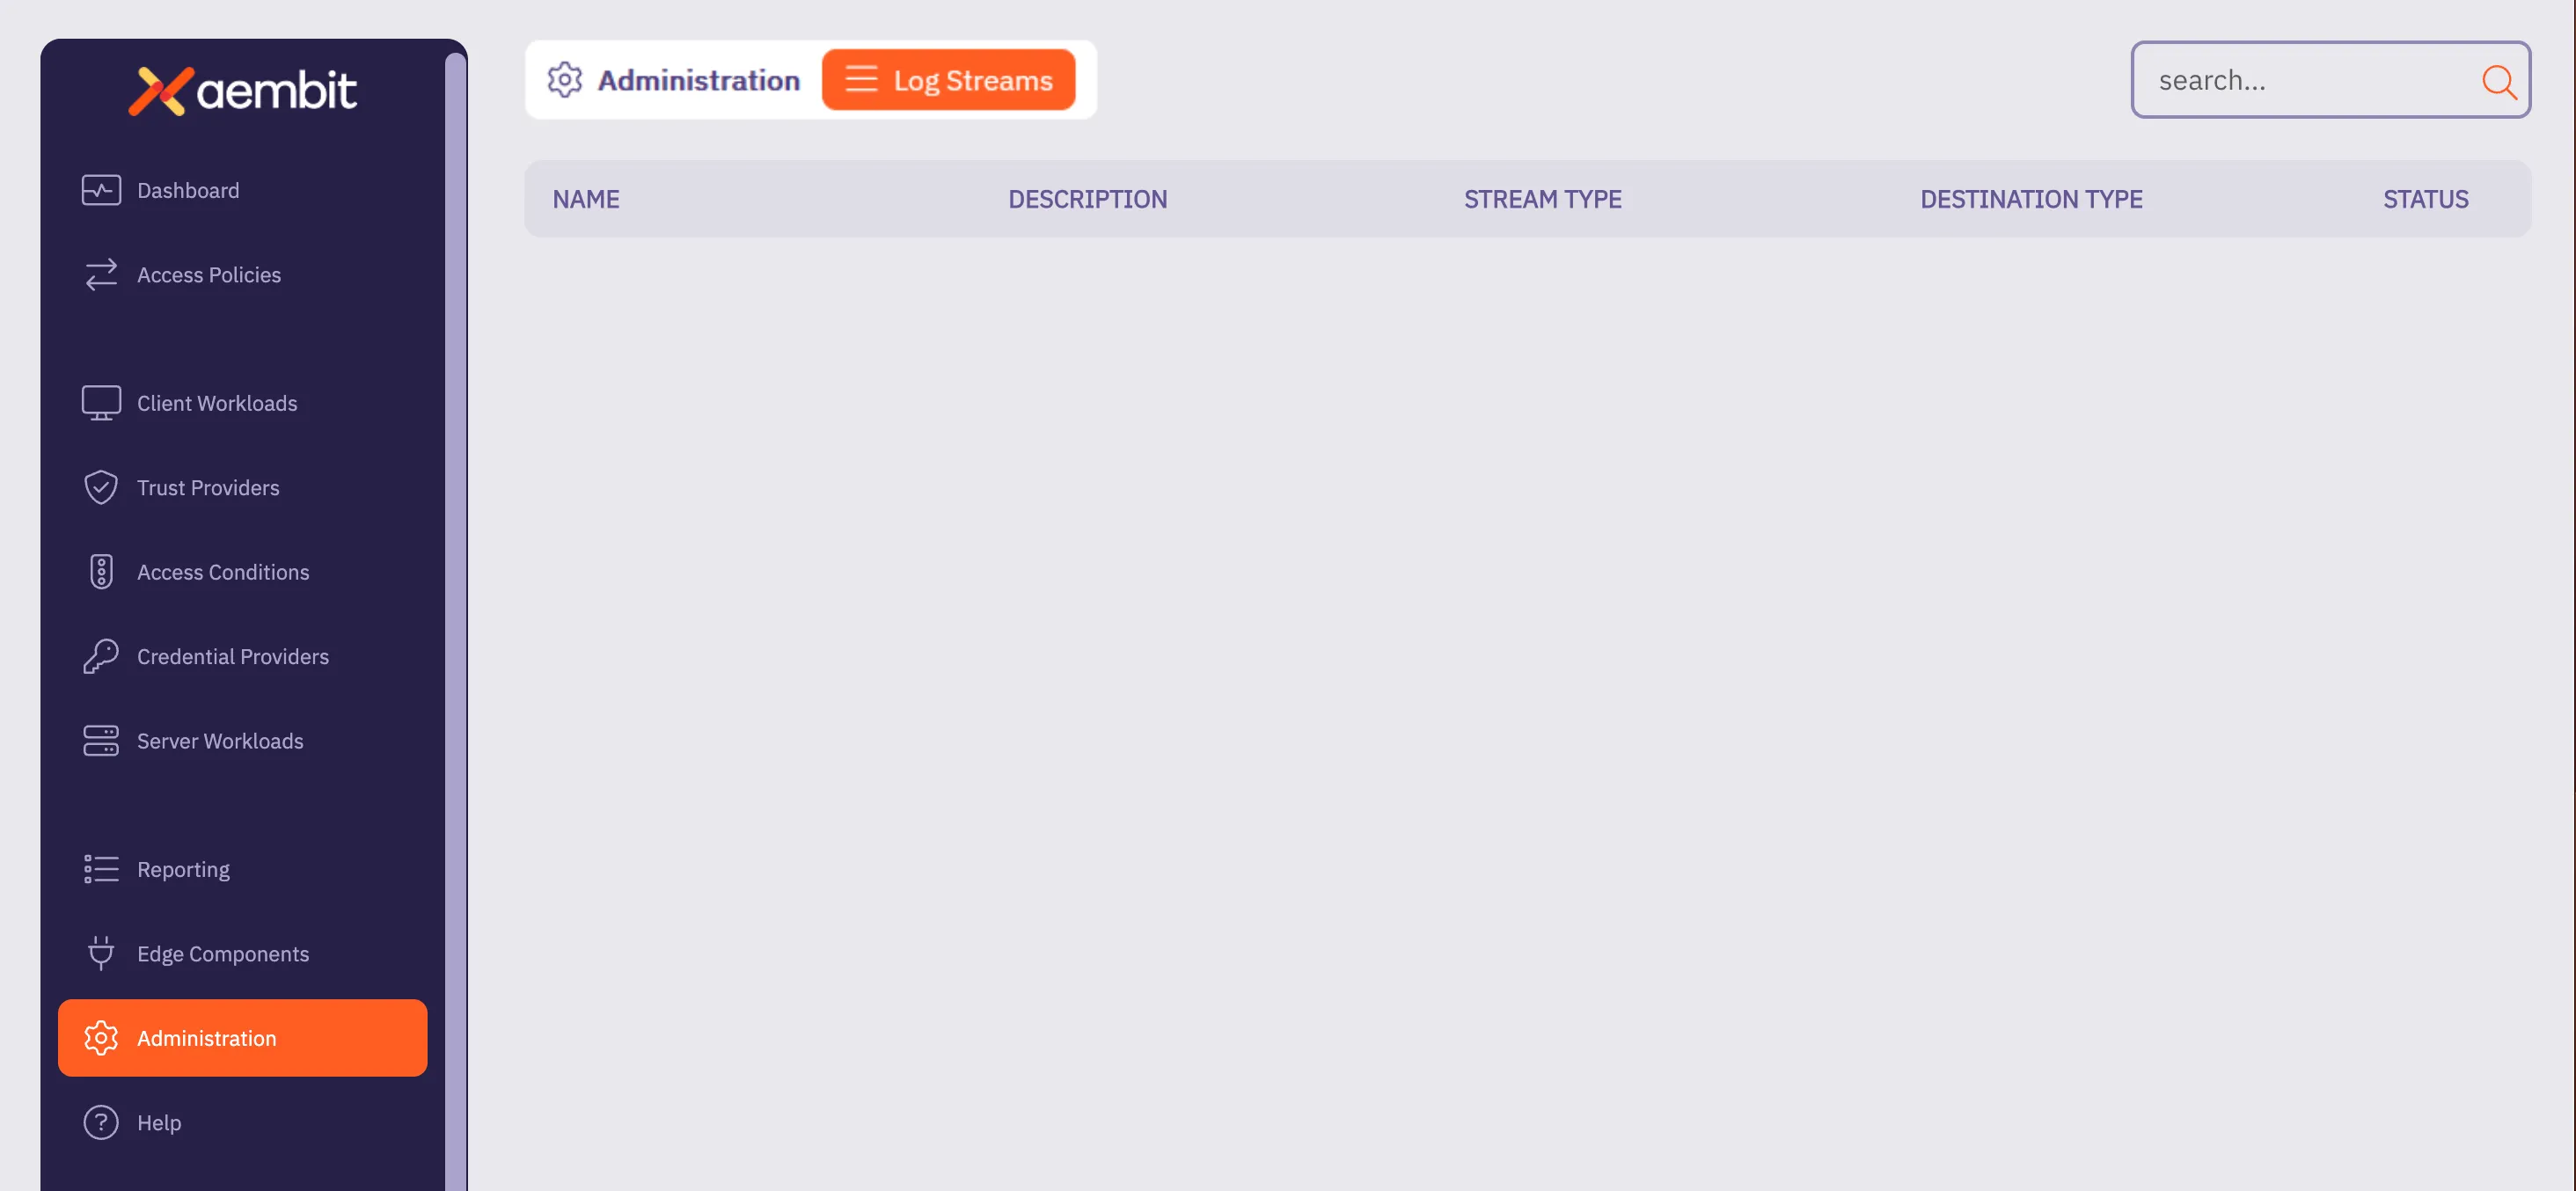
Click Administration in the left sidebar.
-
At the top, select Administration ☰ Log Streams.
Aembit displays the Log Streams page with a list of existing Log Streams.
-
Click + New, which displays the Log Streams pop out menu.
-
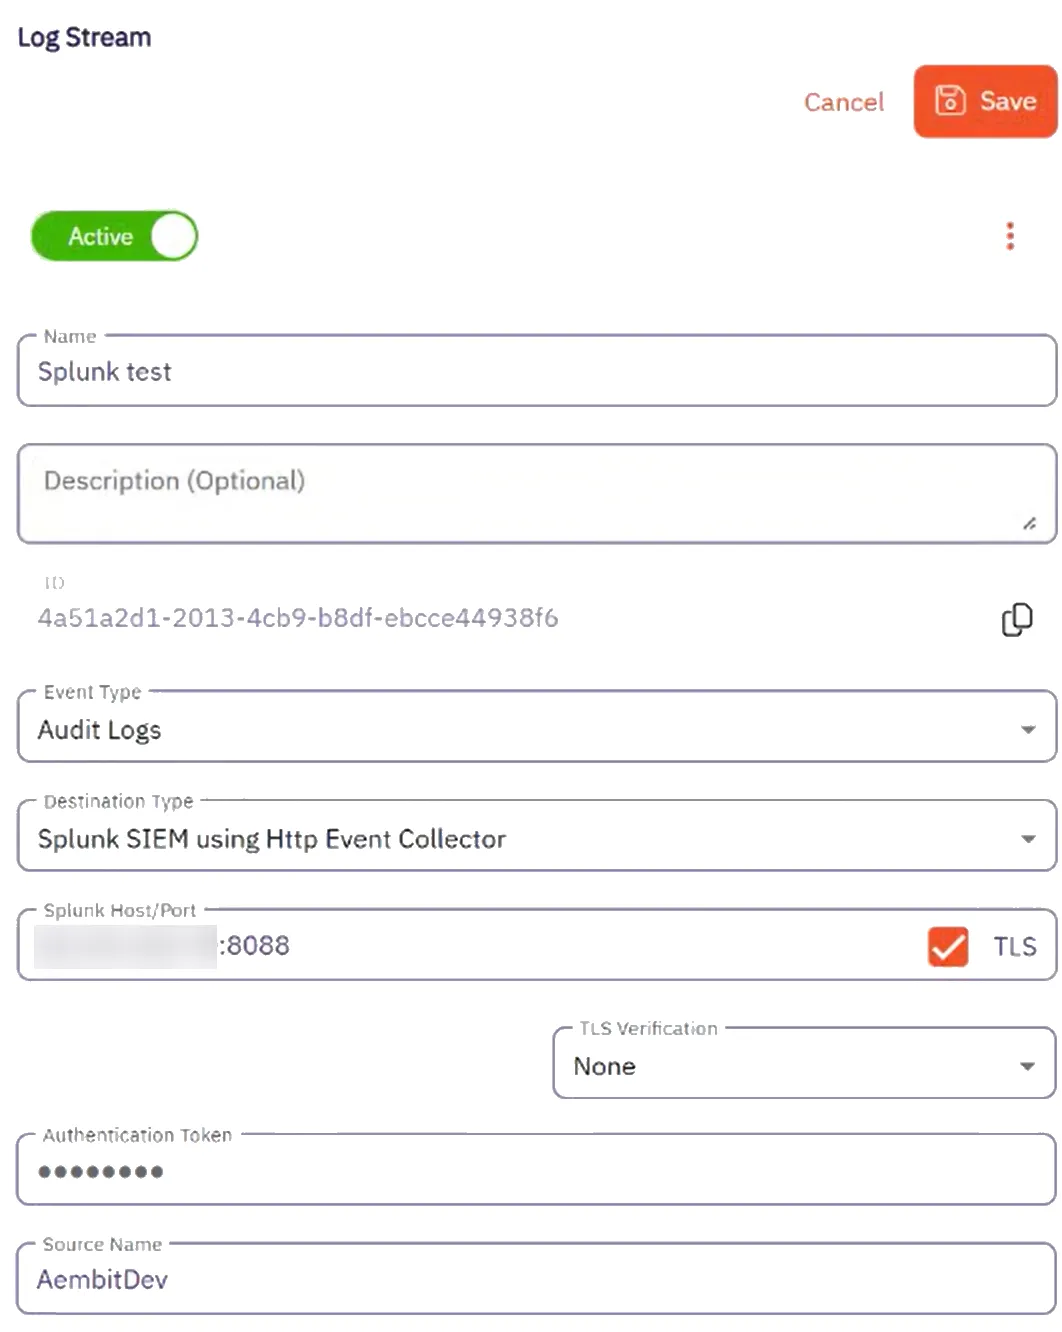
Fill out the following fields:
-
Name - Enter a name for the Log Stream
-
Description - Enter an optional description for the Log Stream
-
Event Type - Select the type of event you want to stream to your Splunk SIEM. Choose from:
Access Authorization Events,Audit Logs, andWorkload Events
-
-
Select Splunk SIEM using Http Event Collector (HEC) as the Destination Type.
-
Fill out the revealed fields:
-
Splunk Host/Port - Enter the hostname or IP address and port of your Splunk host.
- (Optional) Check TLS to enable TLS communication between your Splunk host and Aembit.
-
(Optional) TLS Verification - Select the desired option to enable TLS verification.
-
Authentication Token - Enter the Token Value from your Splunk HEC.
-
Source Name - Enter the Source Name from your Splunk HEC.
-
-
Click Save.
Aembit displays the Log Stream on the Log Streams page.
Once you save your Log Stream, you can view its details by selecting it in the list of Log Streams to see something similar to the following screenshot:
Monitor logs in Splunk SIEM
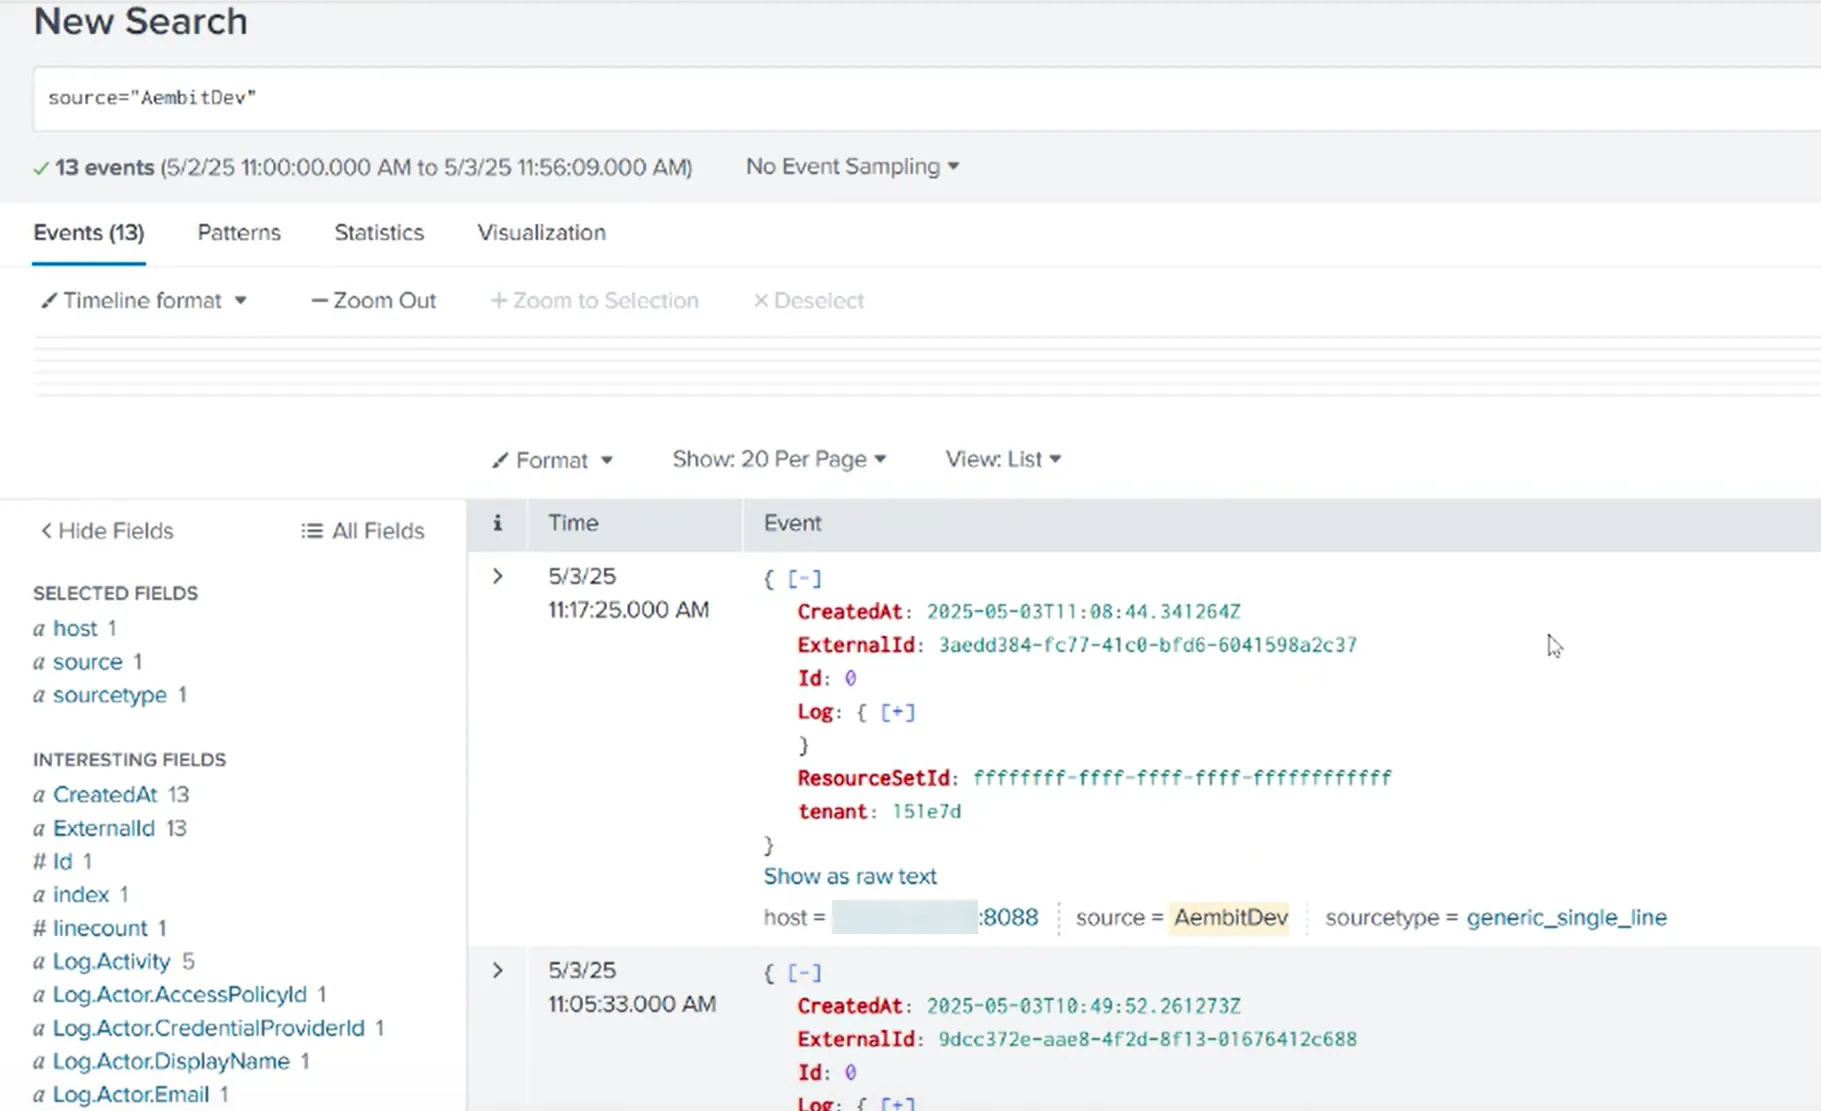
Section titled “Monitor logs in Splunk SIEM”After configuration, you can search and view logs that Aembit generates from the event type you selected in Splunk’s Search and Reporting page using the following search phrase:
source=<source_name>You should see results similar to the following screenshot:
Failure notifications
Section titled “Failure notifications”If your Aembit account has write privileges for Log Streams, Aembit automatically sends you an email notification when Log Stream transactions consistently fail.