# Checking Tenant Health
> This page describes how to check the health of the Aembit Cloud components.
#
When working with Aembit for your environment workloads, you may find it useful to occasionally check the health of the Aembit Cloud Service and associated components. The following services may be checked for current health and status:
* Aembit Status Page
* API/Management Plane
* Edge Controller
* Identity Provider
### Aembit Status Page
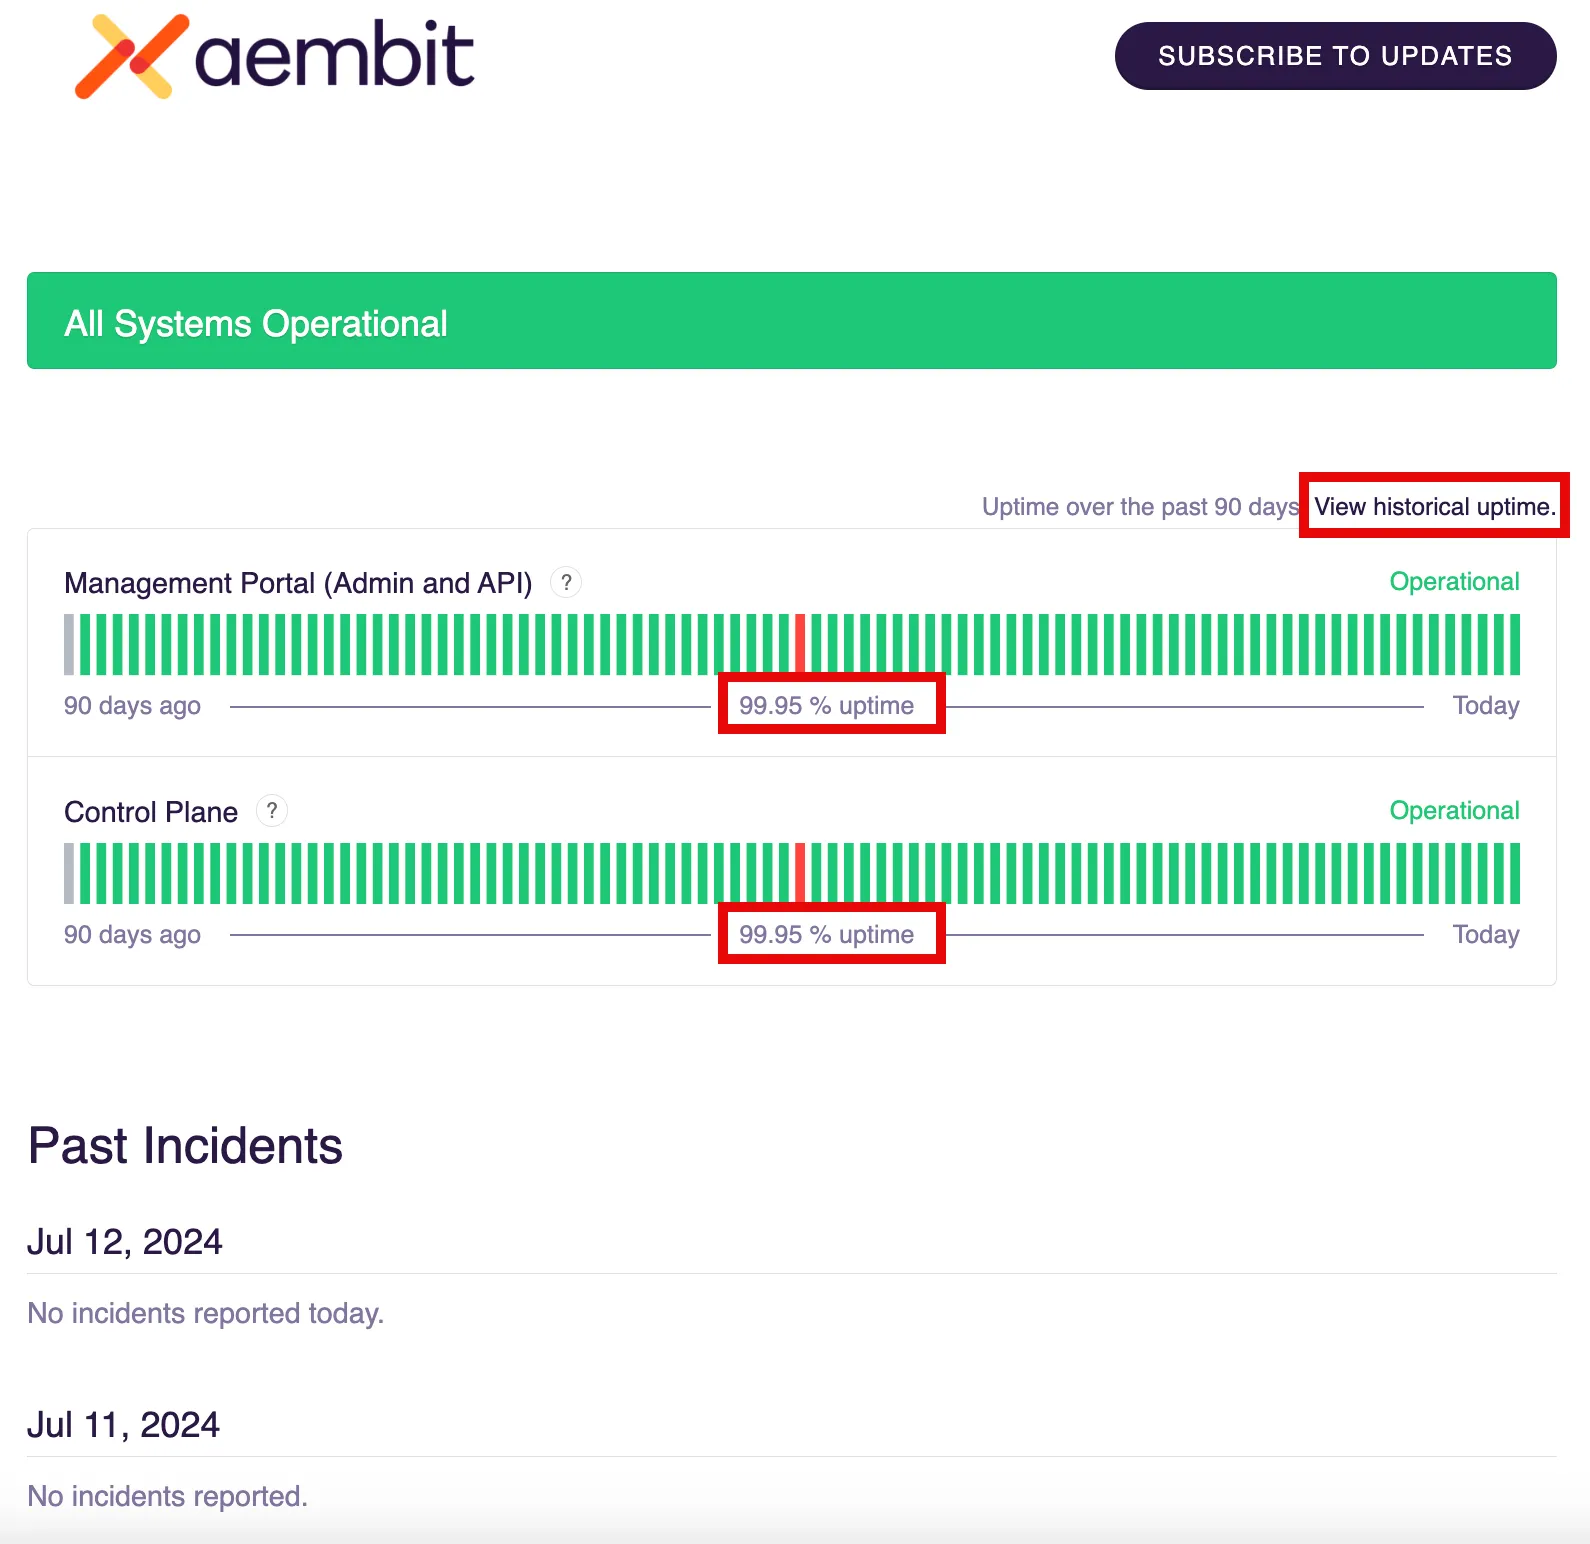
The Aembit Service Status Page displays the current status of the Aembit Service, including any incidents that have been logged by service. You may find this useful if you would like to verify that the service is up and running before working with your Aembit Tenant.
#### Checking the Health of the Aembit Service
To check the current status of the Aembit service:
1. Navigate to the Aembit Status Page by opening a browser and going to the following web address:
2. On this page, you may review the current status of the Aembit service, including the current status of the Management Portal and Control Plane, in addition to a 90-day record of any reported incidents.
> **Note**
>
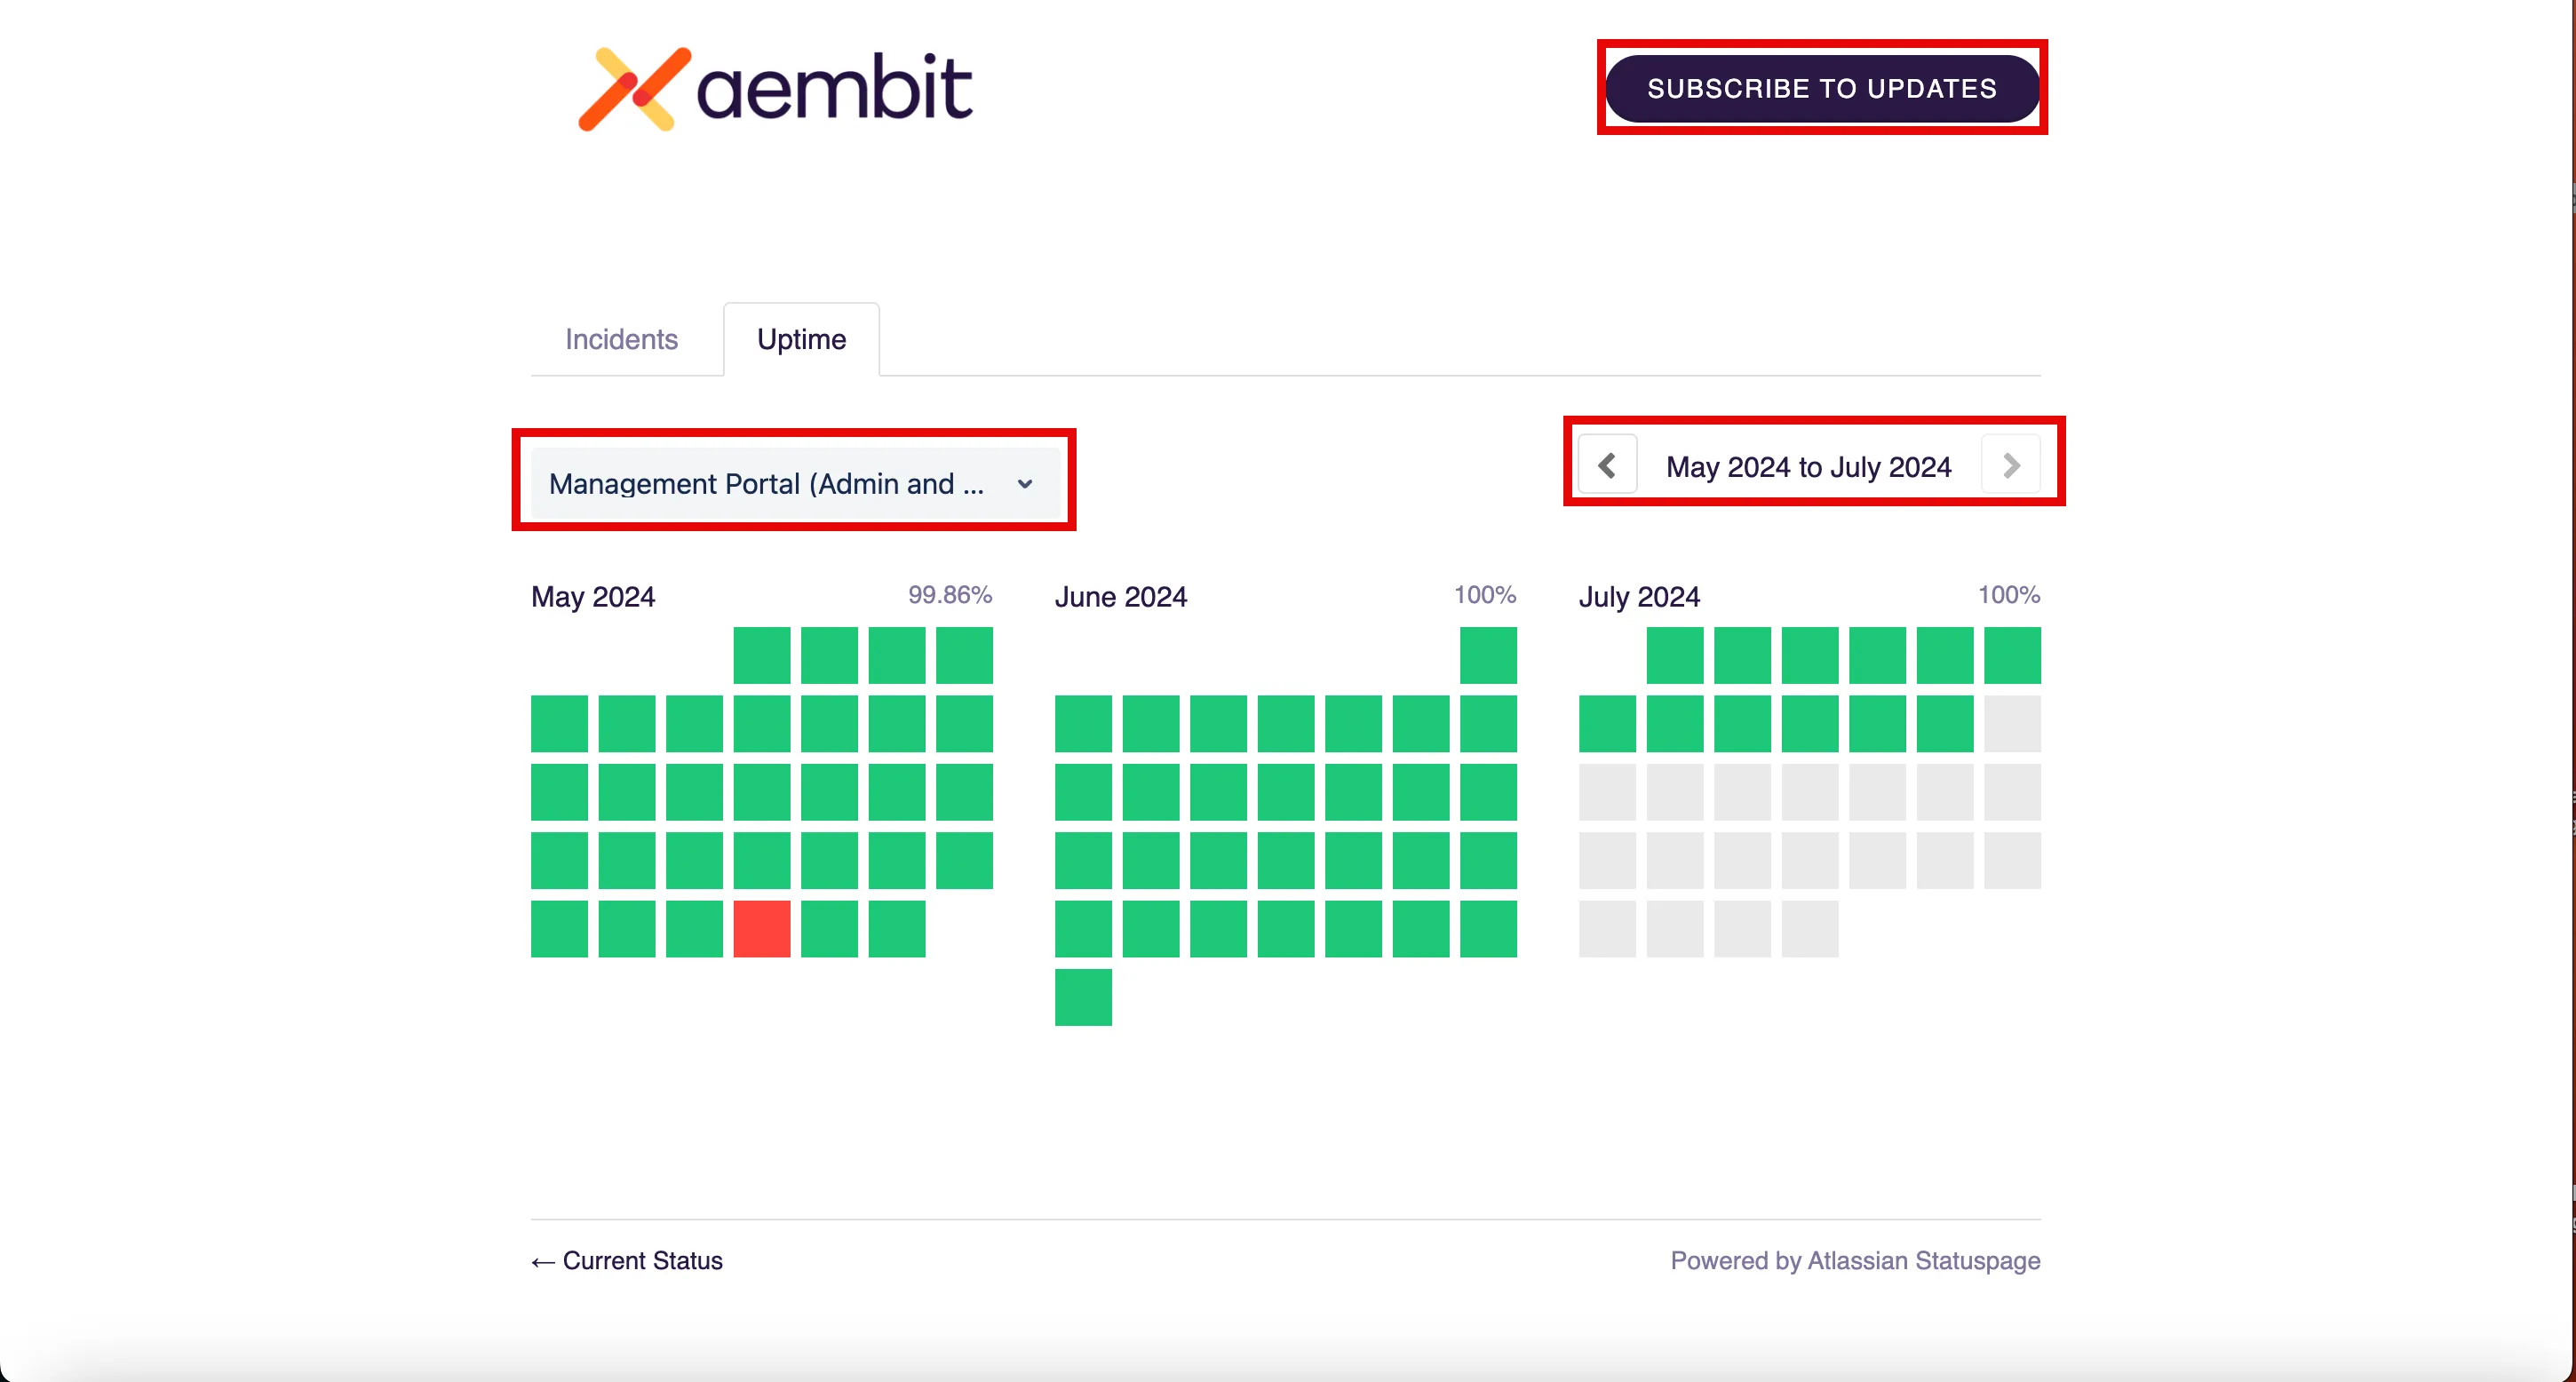
> If you would like to view historical uptime data beyond 90 days, click on the **View historical uptime** link. When you click on this link, you will see an Aembit Historical Data page where you can choose between historical data from either the Management Portal or Control Plane.
>
> 
>
> > **Tip**
> >
> > You may automatically receive Aembit service status updates by clicking on the **Subscribe to Updates** button in the top-right corner of the Status page and entering your email address.
### API/Management Plane
The API/Management Plane is a programmatic interface that enables you to perform many of the same actions and tasks you can perform in your Aembit Tenant. While the Aembit Tenant allows you to perform these tasks in a user interface; sometimes, you may wish to programmatically perform some of these actions, especially if you wish to perform batch operations or write scripts to perform these tasks.
Monitoring the API/Management Plane can be useful in ensuring the endpoints that control these actions are operational and working properly.
#### Checking the Health of the API/Management Plane
To check the health of the API/Management Plane, follow the steps described below.
1. Log into your Aembit Tenant.
2. On the main dashboard page, hover over your name in the bottom left corner of the dashboard. You should see a **Profile** link appear.
3. Click on the **Profile** link to open the User Profile dialog window.
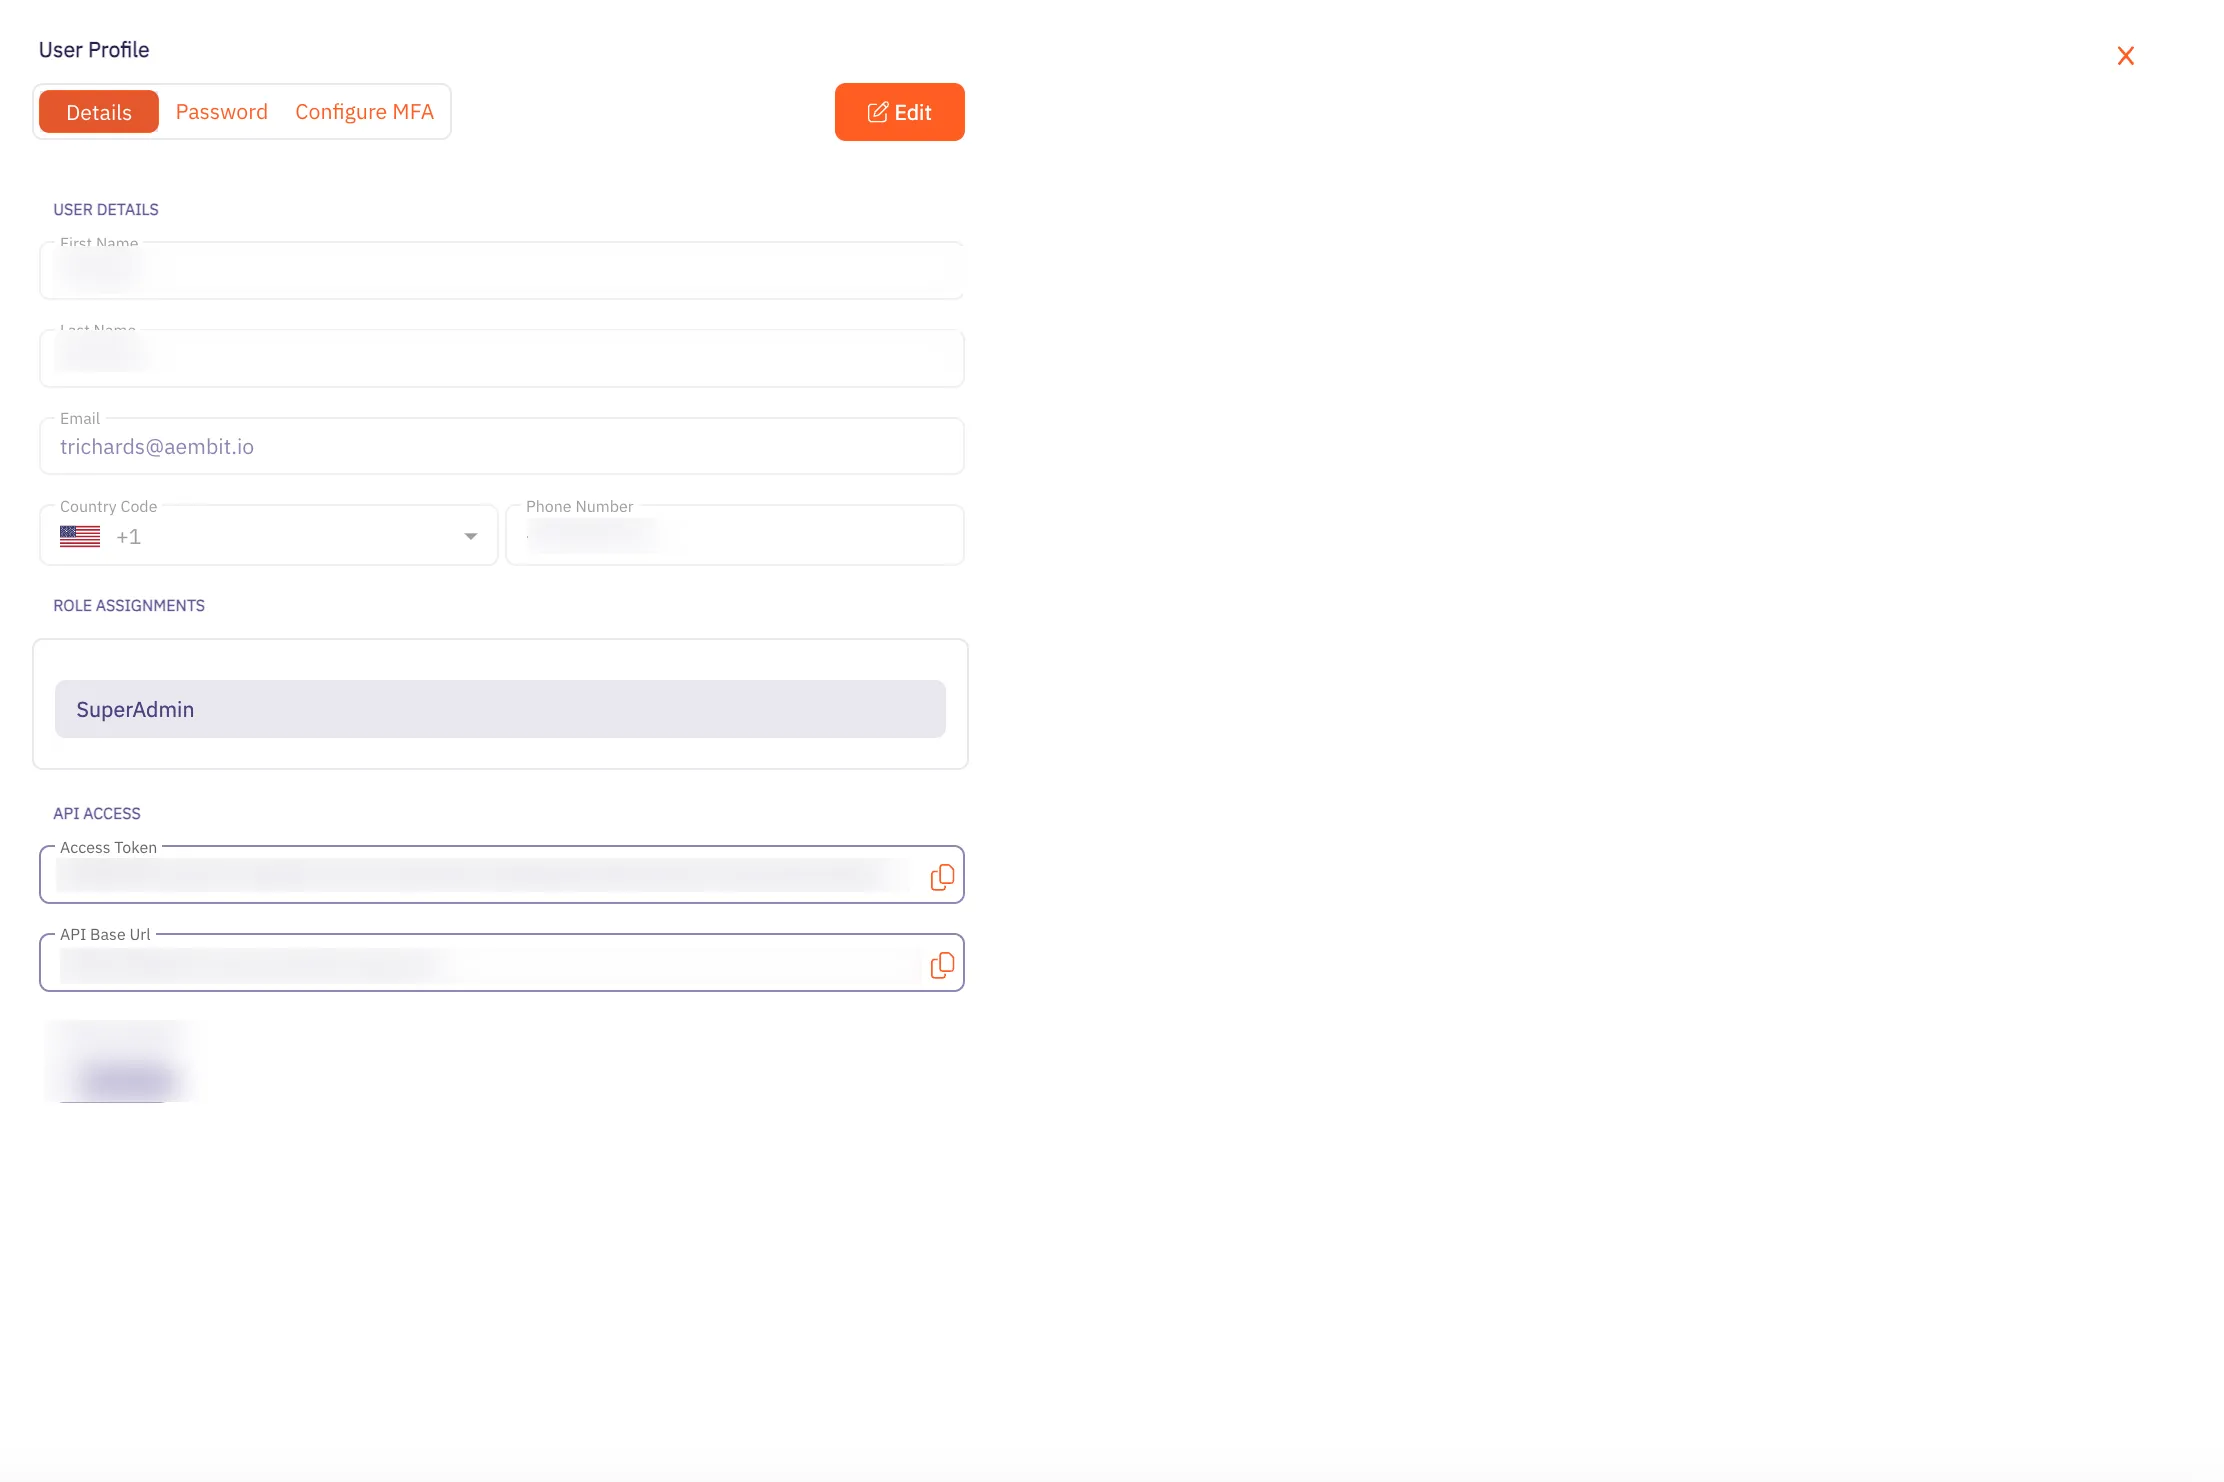
4. In the User Profile dialog window, copy the **API Base Url** value.
5. Execute the following API call to the Aembit server using your API Base Url value that you copied from the User Dialog window.
`api/v1/health`
Where:
* `api` is the service you are calling
* `v1` is the API version
* `health` is the resource you are calling
6. You should receive a `200` HTTP status code if your tenant is operating correctly (referred to as “healthy”). An example of a successful tenant health check response is shown below.
`{"status":"Healthy","version":"===version===","gitSHA":"===sha===","host":"===tenant===.aembit.io","tenant":"===tenant==="}`
### Agent Controller
Agent Controller communicates its health status to Aembit Cloud every 60 seconds (similar to a “heartbeat” request), enabling you to monitor the real-time health status of Agent Controller.
When reviewing the health status of Agent Controller, there are (4) different connection states:
* **Healthy** - The Agent Controller is registered and the connection status is healthy (green).
* **Registered** - This state is only visible if Kerberos is enabled. Agent Controller is registered, but it is not ready to provide Kerberos attestation yet.
* **Unregistered** - The Agent Controller is not registered with a Device Code or Trust Provider (yellow).
* **Registered and Not Connected** - The Agent Controller is registered and healthy, but the connection is down (yellow).
> **Note**
>
> If Agent Controller is in an “inactive” state, Agent Controller status will be displayed with a gray icon in the **Status** column.
#### Checking the Health of the Agent Controller In the Aembit Tenant
To check the health of the Agent Controller in your Aembit Tenant:
1. Log into the Aembit Tenant with your user credentials.
2. Click on the **Edge Components** link in the left sidebar. You will see the Edge Components Dashboard displayed.
> **Note**
>
> By default, The Agent Controllers dashboard is displayed.
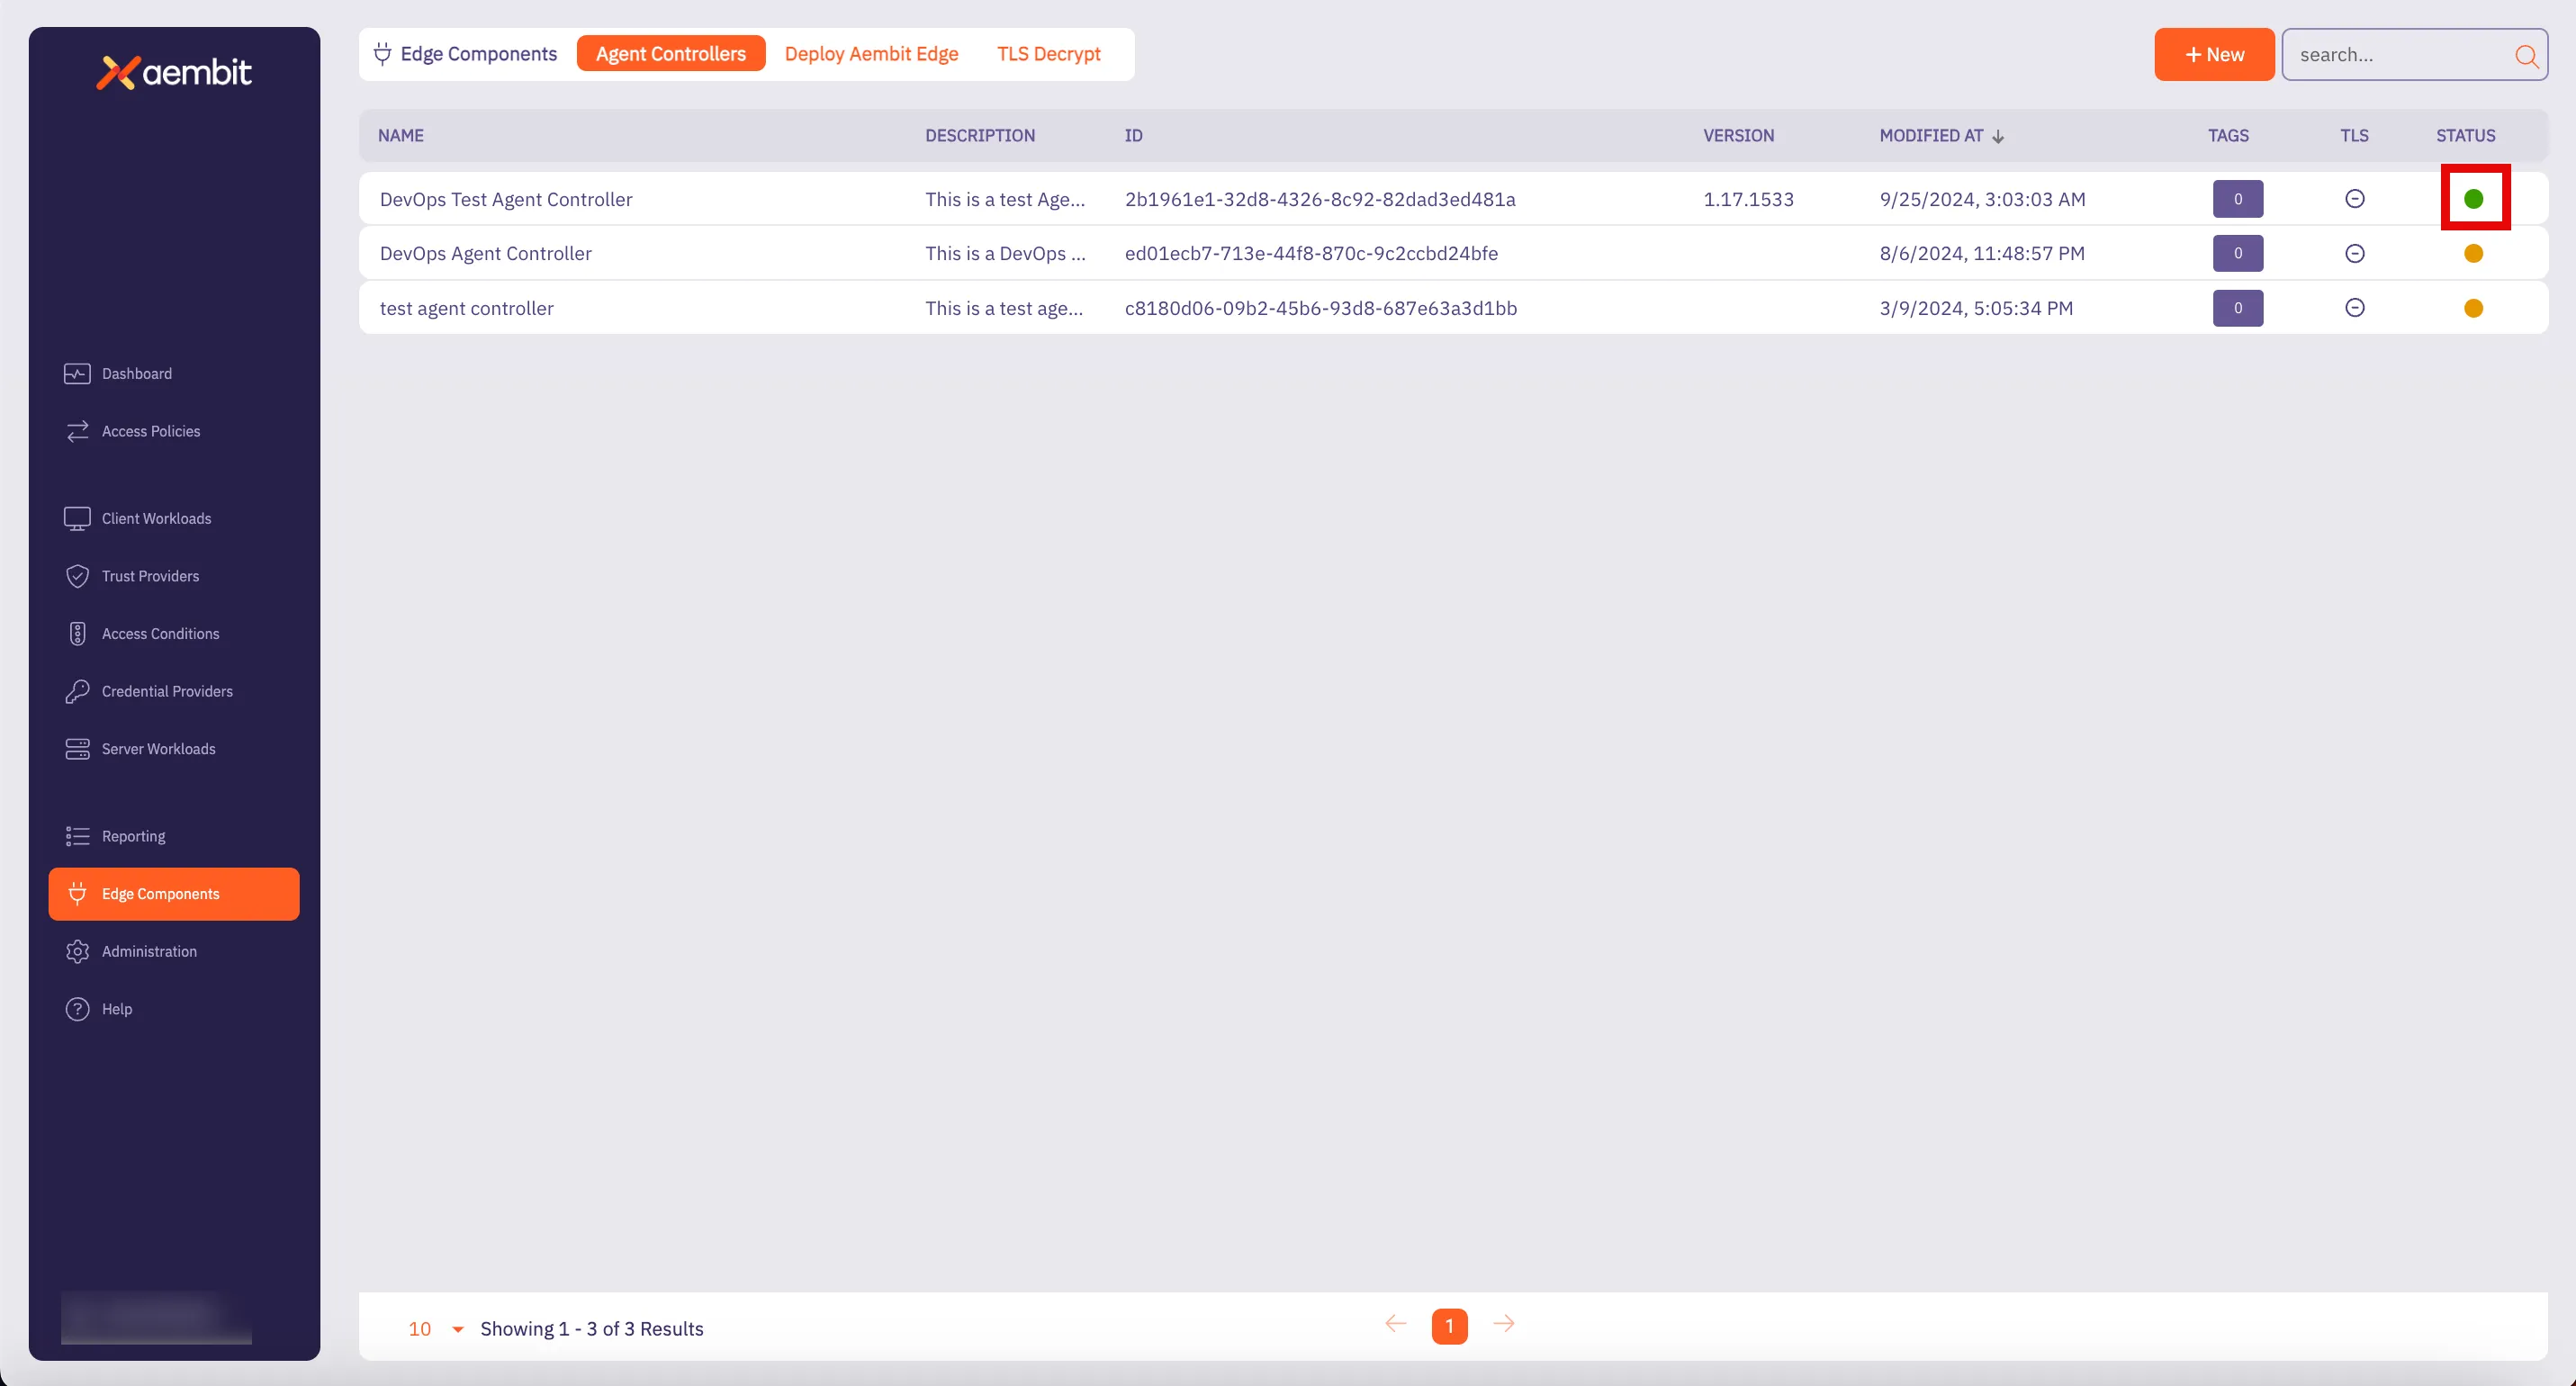
4. From the list of Agent Controllers, locate the Agent Controller you want to check the health and scroll over to the **Status** column.
5. Hover over the **Status** icon to see when the last health check was performed.
### Edge Controller
The Edge Controller is a component within the Aembit Cloud infrastructure that provides endpoints that enable you to generate application events, retrieve configuration information, policies, and credentials via a set of endpoints.
Verifying the Edge Controller, and its endpoints, are operating correctly is important in ensuring that application events and other configuration information is captured and logged, and able to be retrieved by users.
#### Checking the Health of the Edge Controller
To check the health of the Edge Controller:
1. Go to the [gRPC Health Proto GitHub repository](https://github.com/grpc/grpc/blob/master/src/proto/grpc/health/v1/health.proto) and
2. Use the [gRPCurl](https://github.com/fullstorydev/grpcurl) command line tool to verify the Edge Controller is running.
For example, if you run this command with Docker, the command should look like this:
`docker run --rm -v $PWD:/app fullstorydev/grpcurl -v -import-path=/app -proto health.proto tenant.ec.useast2.aembit.io:443 grpc.health.v1.Health/Check`
### Identity Provider
An Identity Provider is a system that stores, manages, and verifies digital identities for users or entities connected to a network or system so a user may be authenticated to use a service. In the Aembit framework, the Identity Provider authenticates users and grants them access to various Aembit services.
Monitoring the health of the Identity Provider ensures authentication and identity verification services are running correctly, and users can be authenticated properly before granting access to Aembit services.
#### Checking the Health of the Identity Provider
If you would like to check the current health of your Identity Provider, the steps are very similar to the steps you followed to check the API/Management Plane, which are described below.
1. In your Aembit Tenant, select the Sign In with Email option.
2. Notice that when you select this option, you will see a Fully Qualified Domain Name (FQDN) in your browser address bar (e.g. ) with your Base URL.
3. Append the FQDN in the address bar with `api/v1/health` like the example shown below.
`https://tenant.id.useast2.aembit.io/api/v1/health`
Where:
* `https://tenant.id.useast2.aembit.io` is the base URL
* `api` is the service being called
* `v1` is the API version
* `health` is the resource being called
4. After clicking enter, you should receive an output message confirming that the Identity Provider is in a “healthy” state.
`{"status":"Healthy","version":"===version===","gitSHA":"===sha===","host":"===tenant===.aembit.io","tenant":"===tenant==="}`